Bug #5525

Dashboard
| Status: | Work Completed-End life cycle | Start date: | October 27, 2015 | |
|---|---|---|---|---|
| Priority: | Normal | Due date: | ||
| Assignee: | % Done: | 100% | ||
| Category: | - | Spent time: | - | |
| Target version: | - |
Description
Hi Wei Kuan,
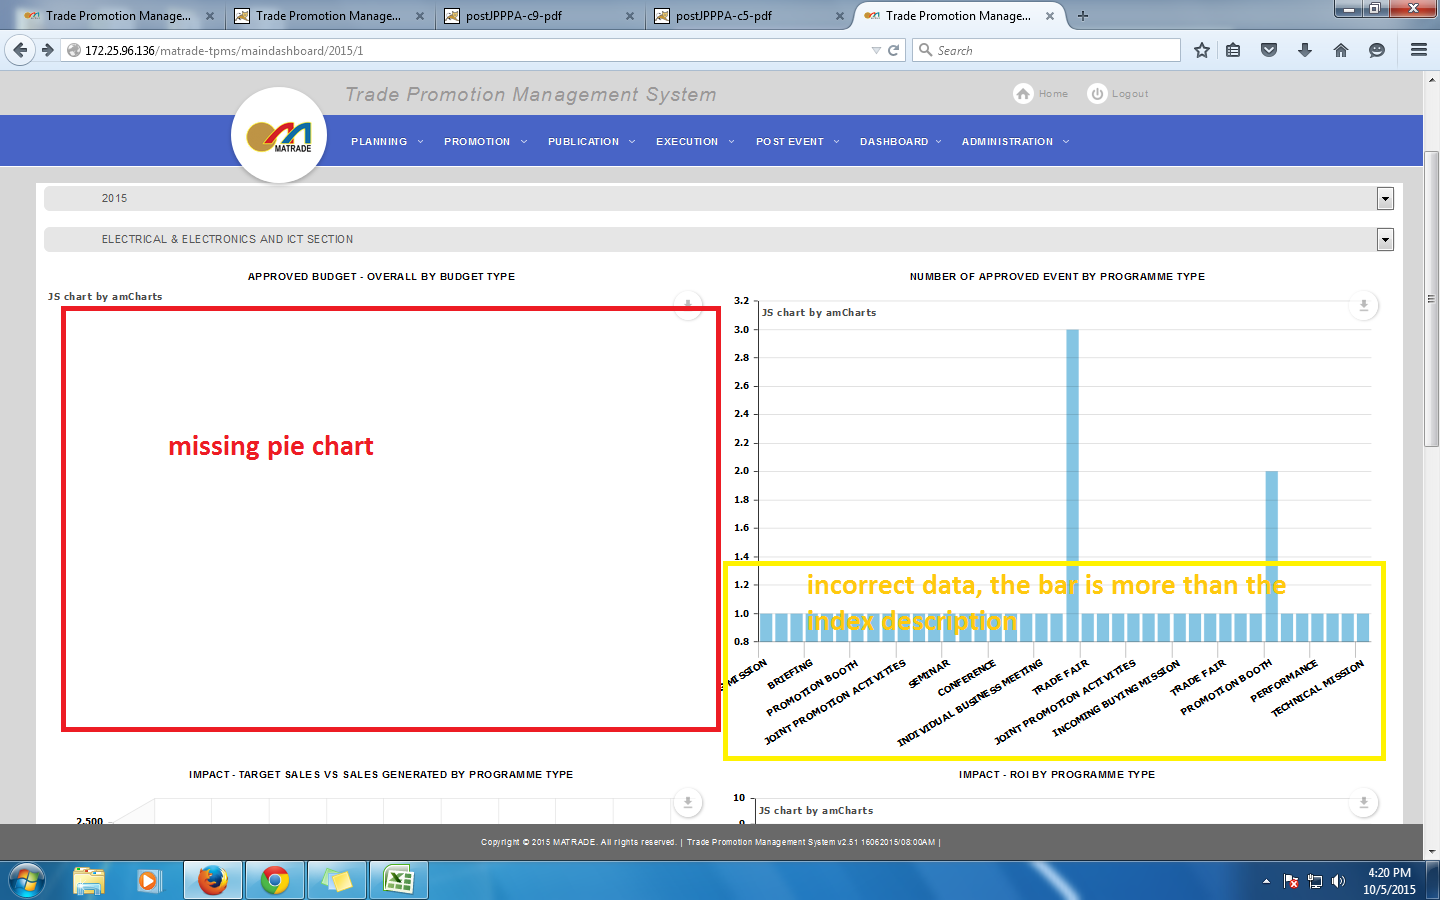
there is some missing Chart for the Dashboard
Please refer to the attachment
Thank You
Subtasks
History
#1
 Updated by Ong Wei Kuan almost 9 years ago
Hi Leonard,
Please hold this, or get someone assist to look into it if it is urgent.
#2
 Updated by Lim Leonard almost 9 years ago
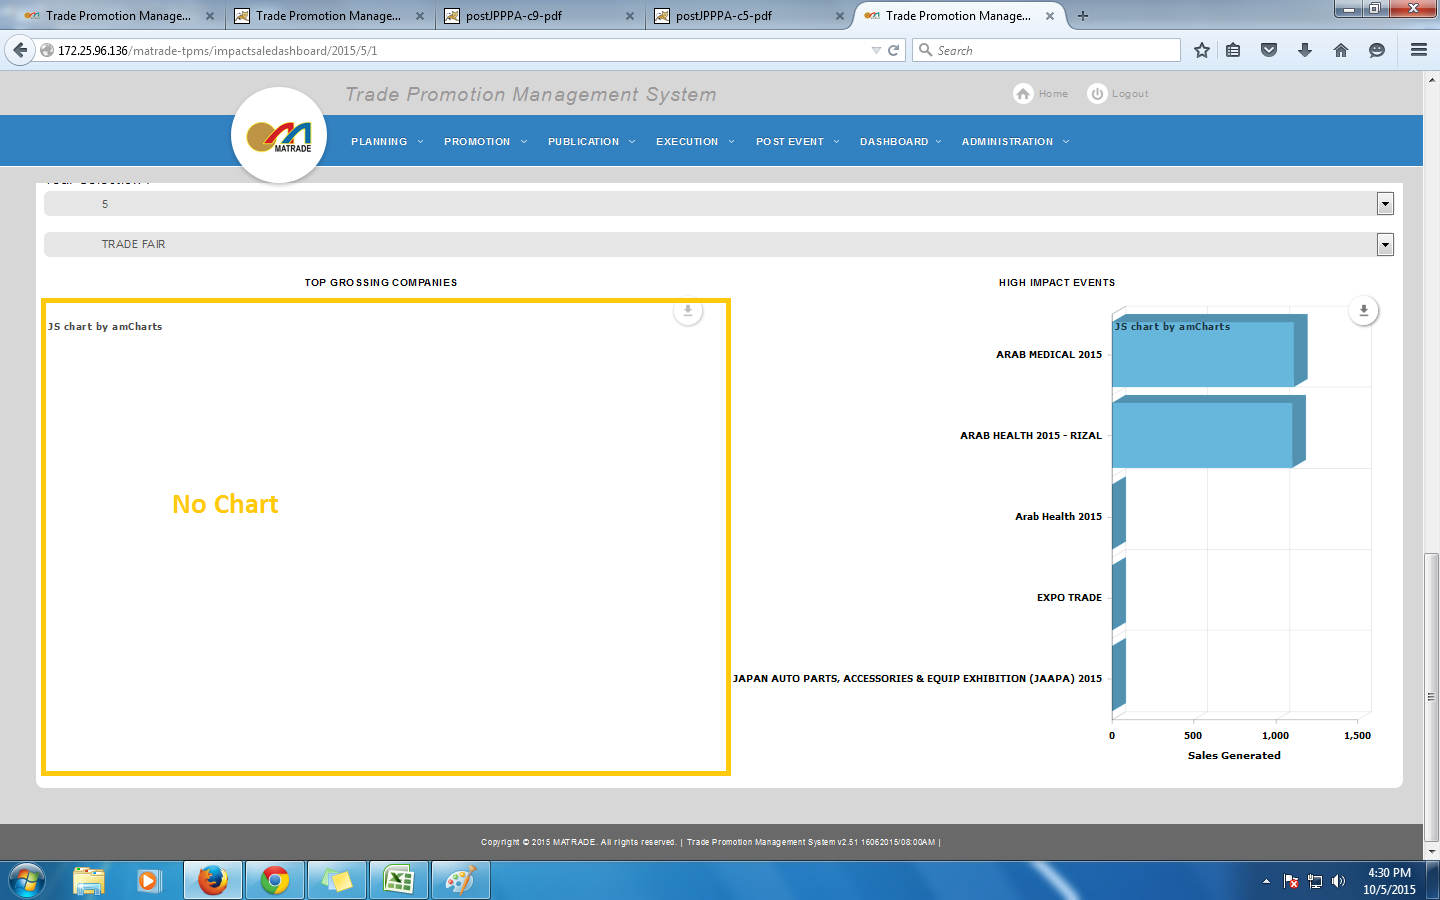
for 'Top Grossing Companies', and 'High Impact Events' from the Impact - Sales sub module
should be displayed in table format. Just display the company name and the sales volume.
Thank You
#3
Updated by Ong Wei Kuan almost 9 years ago
- Status changed from New - Begin Life Cycle to Development / Work In Progress
1. Issue Fixed.
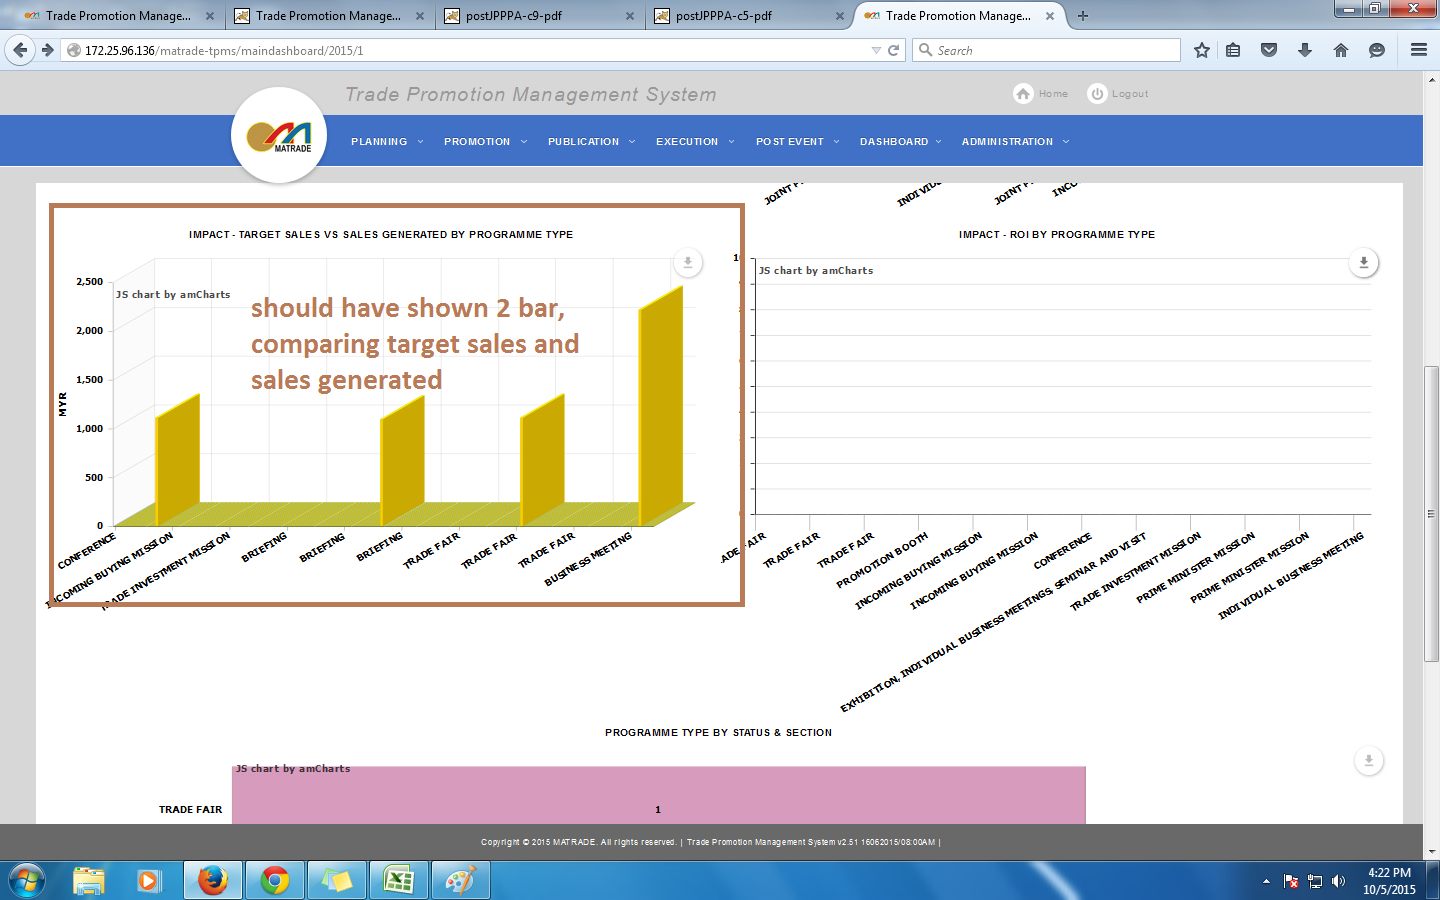
2. No issue actually, it shows 2 bars, just the axis-x data is too many.
3. Can you help to revert the result of below queries,
a- select * from event_comp_sale;
b. select * from event_comp_sale_progress;
4. for 'Top Grossing Companies', and 'High Impact Events' from the Impact - Sales sub module --> Pending.
5. Use abbreviation for programme type & minitry in category axis, and use full name in balloon text(when pointing the bar) - done.
#4
Updated by Ong Wei Kuan almost 9 years ago
- Status changed from Development / Work In Progress to Internal Testing
- Assignee changed from Ong Wei Kuan to Lim Leonard
Hi Leonard,
1. Issue Fixed.
2. No issue actually, it shows 2 bars, just the axis-x data is too many.
3. Can you help to revert the result of below queries,
a- select * from event_comp_sale;
b. select * from event_comp_sale_progress;
4. for 'Top Grossing Companies', and 'High Impact Events' from the Impact - Sales sub module --> done.
5. Use abbreviation for programme type & ministry in category axis, and use full name in balloon text(when pointing the bar) --> done.
#5
Updated by Lim Leonard almost 9 years ago
- Due date set to October 08, 2015
- Assignee changed from Lim Leonard to Shahidan Syahirman
7/10/15
DASHBOARD
Error, cannot open page (HTTP Status 500 - Request processing failed; nested exception is java.lang.ArrayIndexOutOfBoundsException: 3)Overall (MATRADE event)
Data Not TallyBudget (MATRADE event)
Data Not TallyProgramme (MATRADE event)
Data Not TallyImpact - Sales (MATRADE event)
Data Not TallyROI (MATRADE event)
Data Not TallyJPPPA (JPPPA event)
Please kindly assist
Thank You
#6
 Updated by Norhaidah Md Dasuki almost 9 years ago
- Status changed from Internal Testing to Development / Work In Progress
#7
 Updated by Shahidan Syahirman almost 9 years ago
- Status changed from Development / Work In Progress to Internal Testing
- Assignee changed from Shahidan Syahirman to Lim Leonard
please check the data if it tally or not
#8
Updated by Lim Leonard almost 9 years ago
OVERALL
- to put ':' beside year selection
- download icon on each graph are missing
- to put the label of the year and/or month on each graph
- to put the unit matrix on each graph (e.g MYR / USD / UNIT / etc)
BUDGET
approve budget
- to put ':' beside year selection and Budget type selection
- download icon on each graph are missing
- to put the label of the year and/or month on each graph
- to put the unit matrix on each graph (e.g MYR / USD / UNIT / etc)
utilized budget
- Missing Utilized Budget - Overall By budget Type
- to put ':' beside year selection and Budget type selection
- download icon on each graph are missing
- to put the label of the year and/or month on each graph
- to put the unit matrix on each graph (e.g MYR / USD / UNIT / etc)
PROGRAMME
- to put ':' beside year selection
- download icon on each graph are missing
- to put the label of the year and/or month on each graph
- to put the unit matrix on each graph (e.g MYR / USD / UNIT / etc)
IMPACT - SALES
- to put ':' beside year selection, Programme Type, top rank
- to change year selection to 'top rank'
- download icon on each graph are missing
- to put the label of the year and/or month on each graph
- to put the unit matrix on each graph (e.g MYR / USD / UNIT / etc)
- Impact - Target Sales vs Sales generated by Sector - missing some of the label
- Impact - target sales vs sales generated by Section - Missing Some of the label
- Impact - target sales vs sales generated by Region - Missing Some of the label
- sales generated need to have comma, for monetary format
- no data for 'top grossing company'
ROI
- to put ':' beside year selection
- download icon on each graph are missing
- to put the label of the year and/or month on each graph
- to put the unit matrix on each graph (e.g MYR / USD / UNIT / etc)
JPPPA
- to put ':' beside year selection
- download icon on each graph are missing
- to put the label of the year and/or month on each graph
- to put the unit matrix on each graph (e.g MYR / USD / UNIT / etc)
Please kindly assist
#9
Updated by Lim Leonard almost 9 years ago
- Status changed from Internal Testing to Development / Work In Progress
- Assignee changed from Lim Leonard to Shahidan Syahirman
#10
Updated by Shahidan Syahirman almost 9 years ago
- Status changed from Development / Work In Progress to Internal Testing
- Assignee changed from Shahidan Syahirman to Lim Leonard
#currently there no dummy data available for impact sale dashboard report
#utilize budget piechart cannot show 0 value. so the piechart is not available.
please help recheck
#11
Updated by Lim Leonard almost 9 years ago
Pending,
need more data to further test.
#12
Updated by Lim Leonard almost 9 years ago
- Status changed from Internal Testing to Development / Work In Progress
Hi, Iman,
It is confirmed that the data should already exist
please fix the query
Thank You
#13
Updated by Lim Leonard almost 9 years ago
- Assignee changed from Lim Leonard to Shahidan Syahirman
#14
Updated by Shahidan Syahirman almost 9 years ago
- Assignee changed from Shahidan Syahirman to Lim Leonard
hi leo,
kindly assist
#15
Updated by Shahidan Syahirman almost 9 years ago
- Status changed from Development / Work In Progress to Internal Testing
hi leo,
dashboard has already fixed as requested.
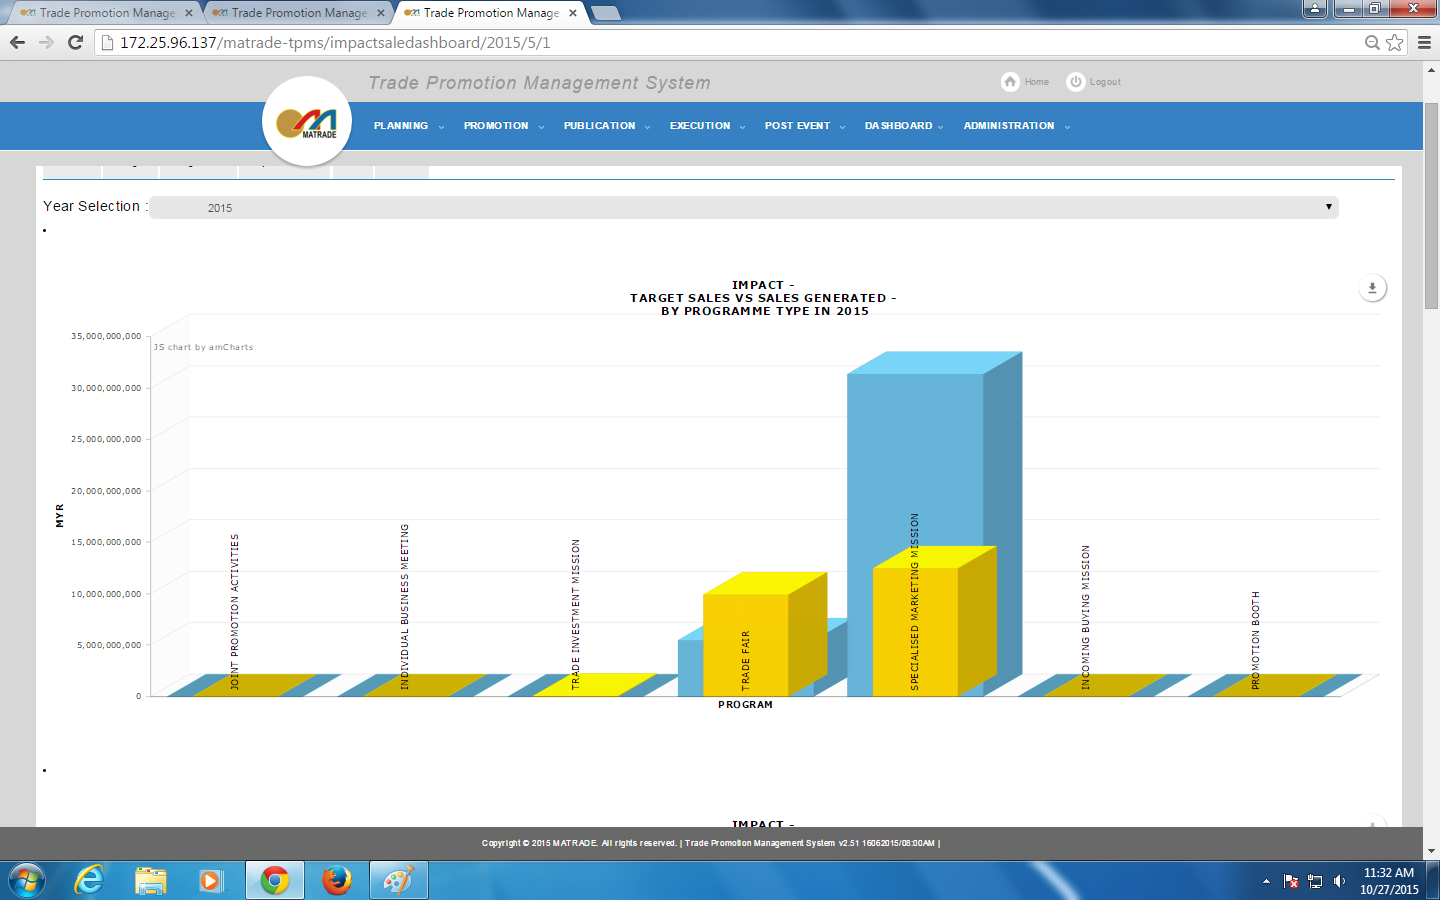
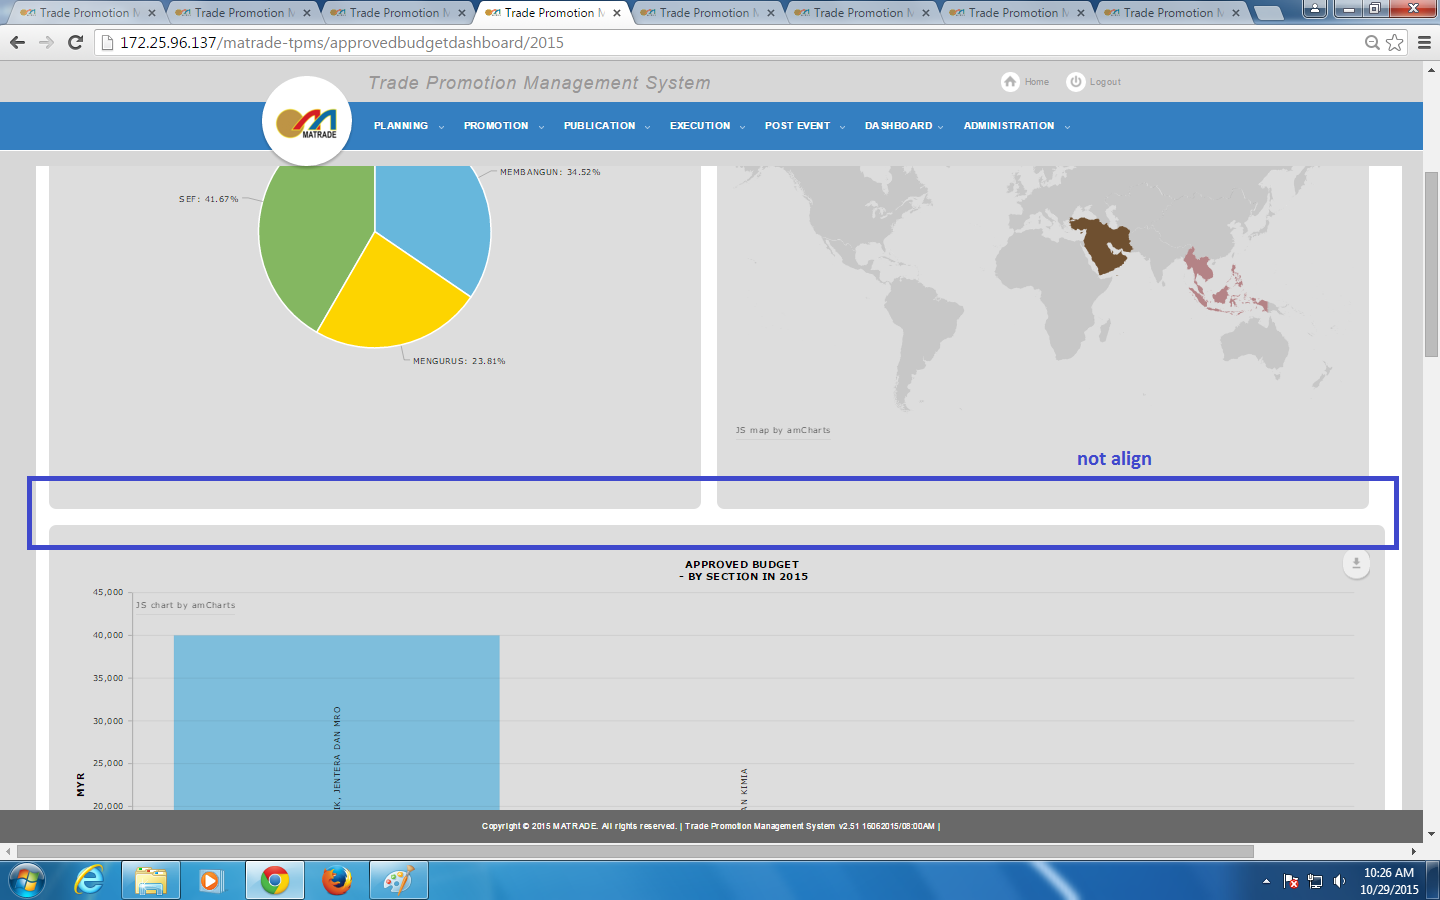
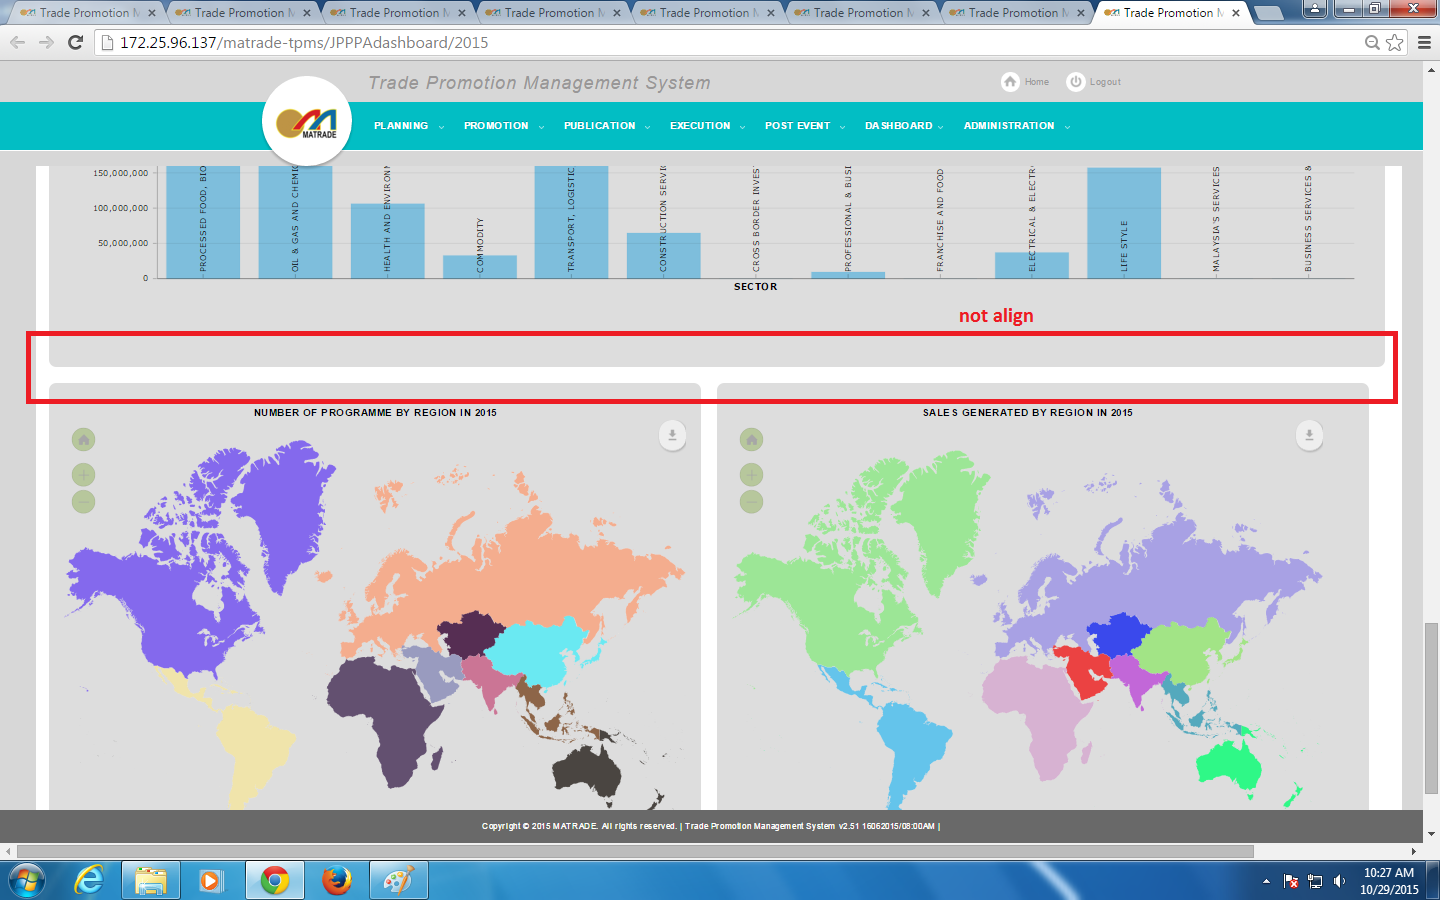
#use 2D instead of 3D chart
#align chart to be within background
just the query need confirmation with najmi.
#target sale : source appoint already correct, it just that the source has no data (null) as no one updated it
#sale generated : source appoint already correct, it just that the source has no data (null) as no one updated it
kindly assist
ty
#16
Updated by Lim Leonard almost 9 years ago
- Status changed from Internal Testing to Development / Work In Progress
- Assignee changed from Lim Leonard to Najmi Pasarudin
Hi Najmi,
Please help on the data query
thank you
#17
Updated by Lim Leonard almost 9 years ago
- File Dashboard - 3d graph.png added
- File Dashboard - Overall.png added
- Assignee changed from Najmi Pasarudin to Shahidan Syahirman
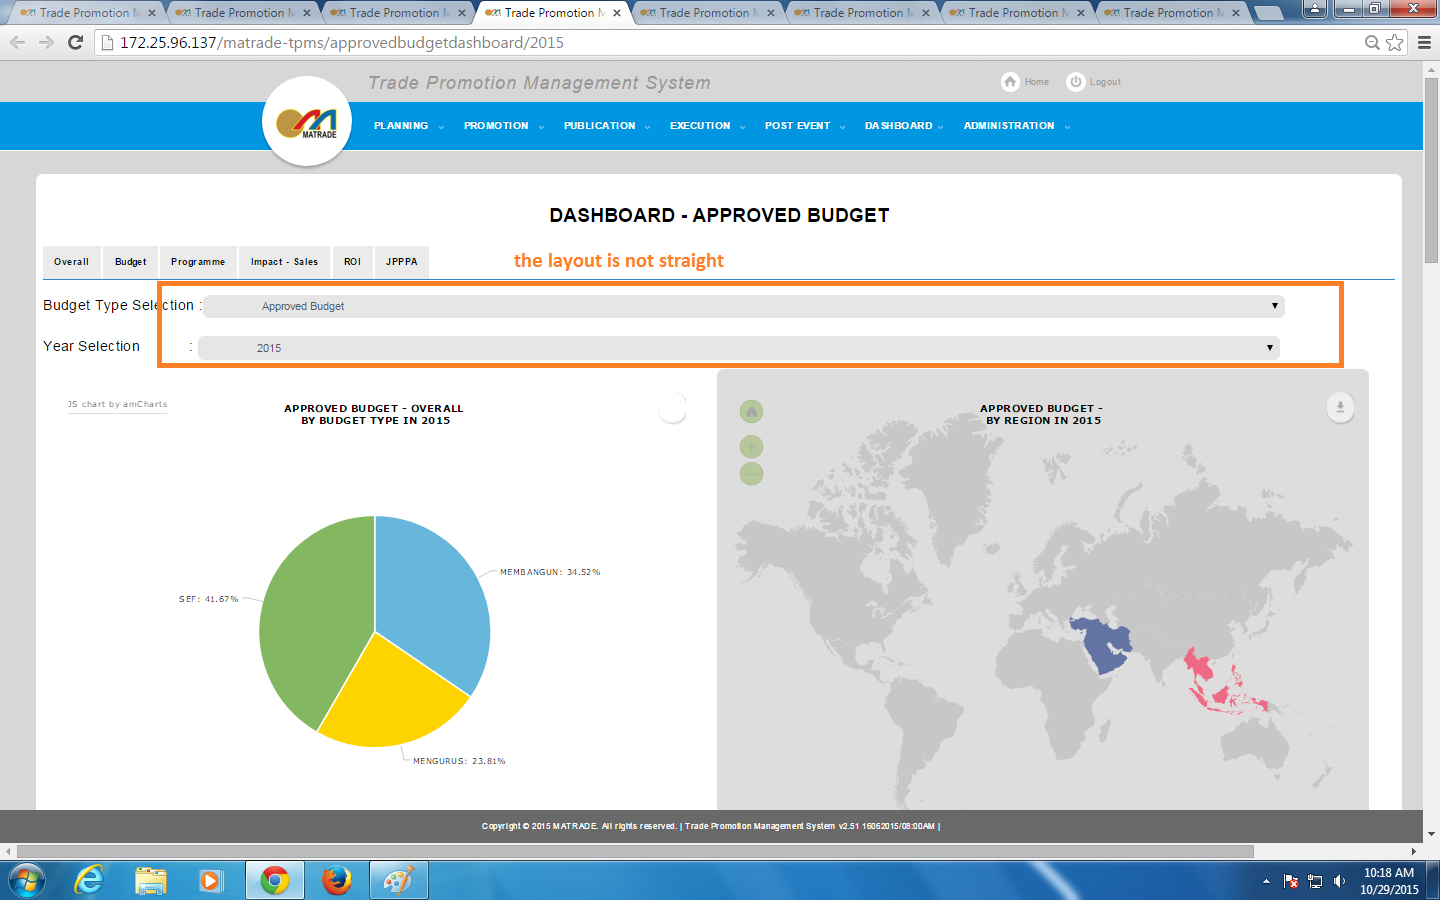
Hi Iman,
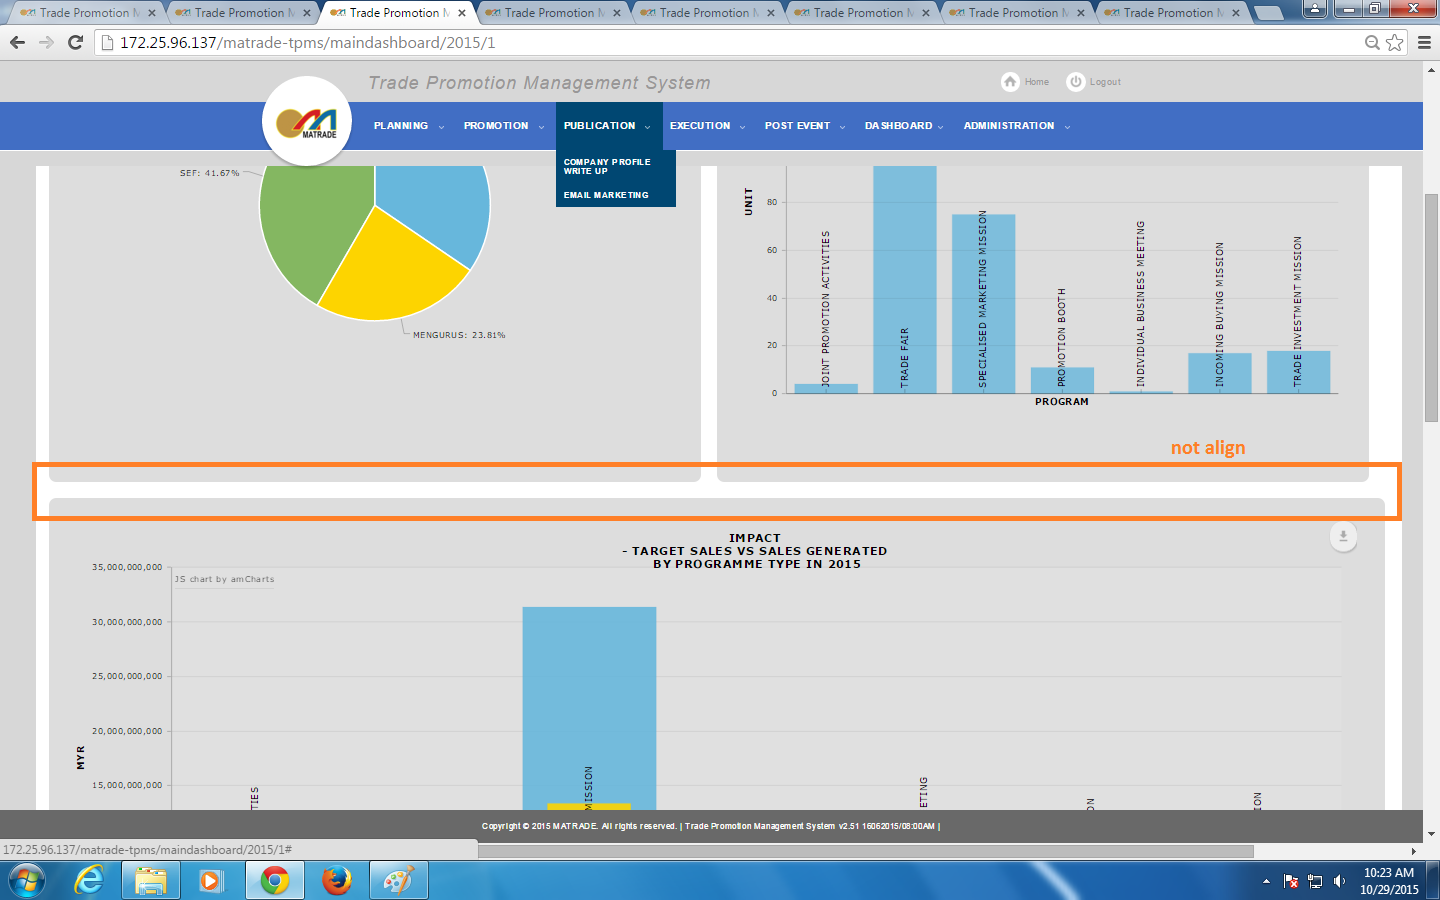
There are some issues for the layout of the dashboard
- need to put background for each graph, to easier separate between graph
- to change 3D graph to 2D, Please refer to attachment
- to change overall layout, please refer to attachment
Please kindly assist
Thank You
#18
 Updated by Najmi Pasarudin almost 9 years ago
Comment on Overall Dashboard (Based on UAT data):
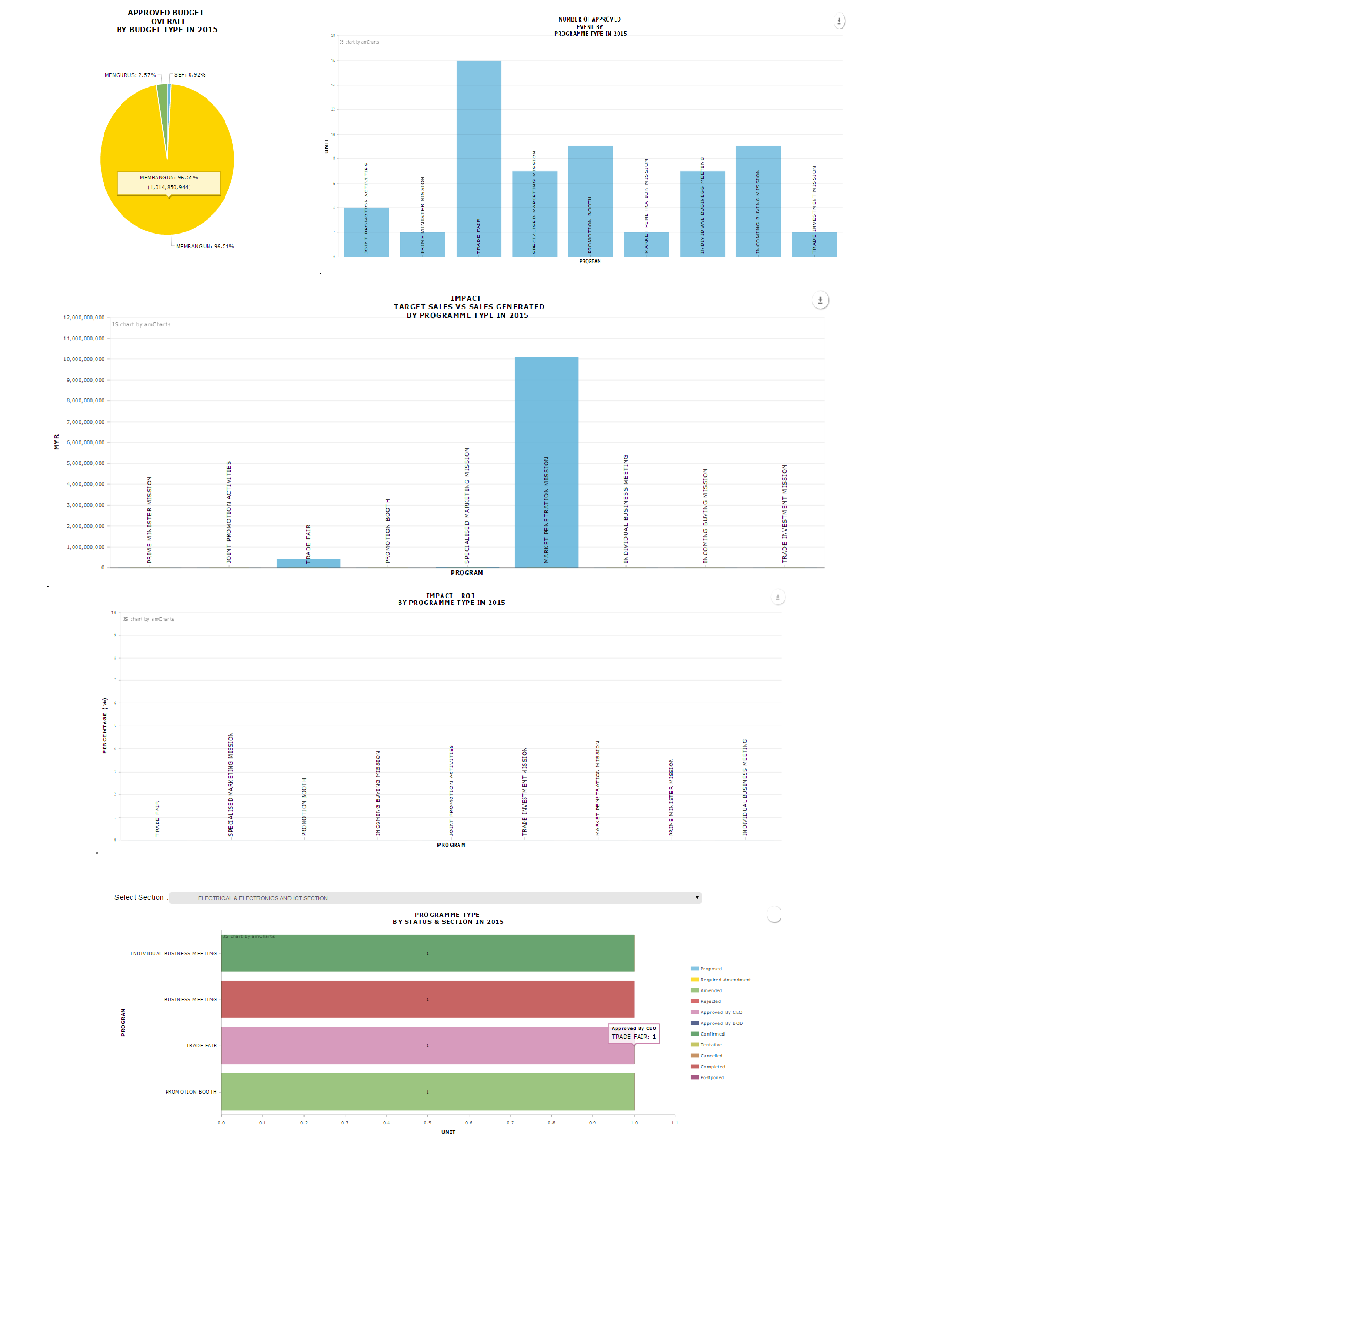
1. In "IMPACT TARGET SALES VS SALES GENERATED BY PROGRAMME TYPE IN 2015" chart, there are sales generated shown in the chart.
However, in "IMPACT - ROI BY PROGRAMME TYPE IN 2015" chart, which calculate ROI = Sales Generated / Utilised Budget, sales generated is 0. Please check the query.(This also impact ROI dashboard)
#19
Updated by Najmi Pasarudin almost 9 years ago
Comment on Overall Dashboard (Based on UAT data):
1. In "IMPACT TARGET SALES VS SALES GENERATED BY PROGRAMME TYPE IN 2015" chart, there are sales generated shown in the chart.
However, in "IMPACT - ROI BY PROGRAMME TYPE IN 2015" chart, which calculate ROI = Sales Generated / Utilised Budget, sales generated is 0. Thus, showing nothing in chart. Please check the query.
(This also impact ROI dashboard)
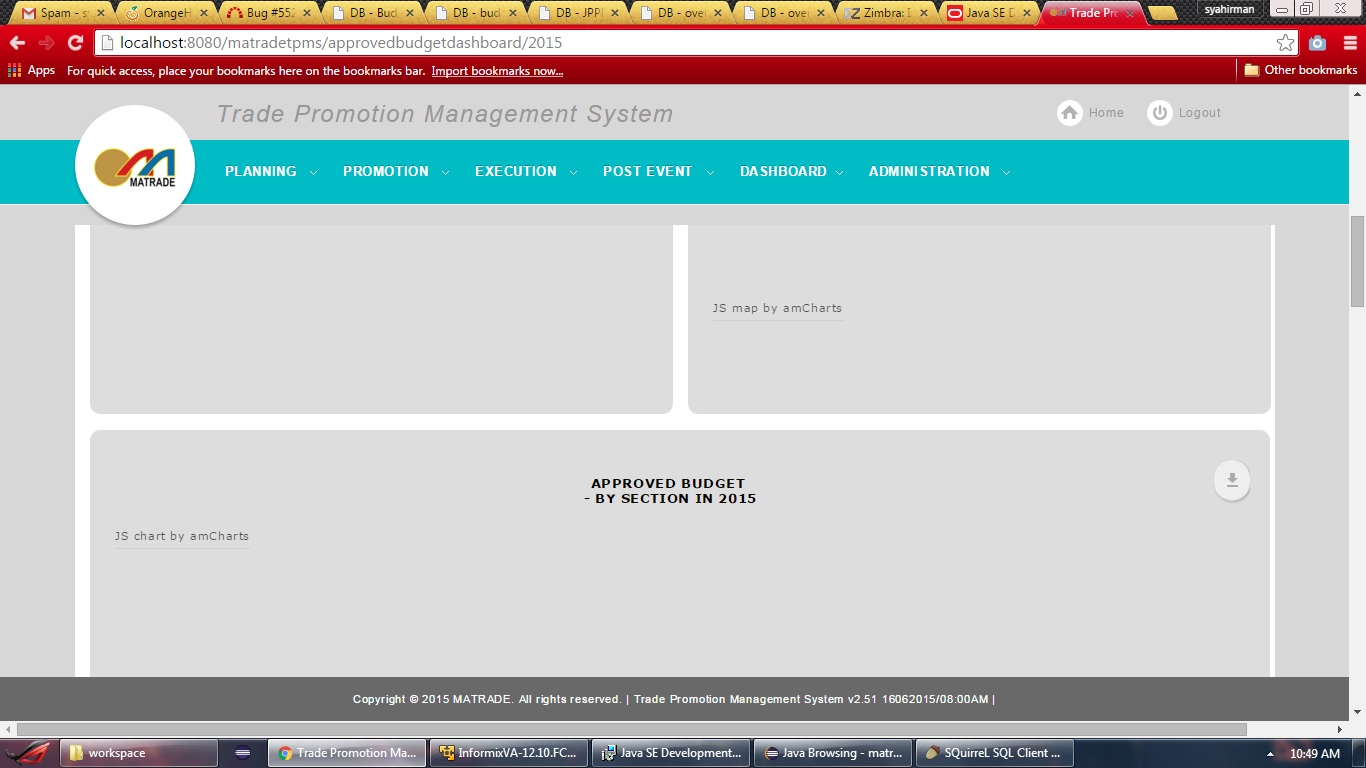
Comment on Budget Dashboard (Based on UAT data):
1. Approved budget pie chart actualy showing utilised budget and Utilised budget is showing nothing. Please relocate the label and charts.
Note:
a. Approved budget pie chart should be same with Overall dashboard.
b. event_borang_p is for utilised budget.
Comment on Programme Dashboard (Based on UAT data):
1. "NUMBER OF APPROVED EVENT BY PROGRAMME TYPE IN 2015" shows nothing while the chart from Overall Dashboard shows there is data.
Comment on ROI Dashboard (Based on UAT data):
1. In "IMPACT - ROI BY PROGRAMME TYPE IN 2015" chart, which calculate ROI = Sales Generated / Utilised Budget, sales generated is 0. Thus, showing nothing in chart. Please check the query.
#20
Updated by Najmi Pasarudin almost 9 years ago
Updated comment:
1. Comment on Overall Dashboard (Based on UAT data):
- In "IMPACT TARGET SALES VS SALES GENERATED BY PROGRAMME TYPE IN 2015" chart, there are sales generated shown in the chart.
However, in "IMPACT - ROI BY PROGRAMME TYPE IN 2015" chart, which calculate ROI = Sales Generated / Utilised Budget, sales generated is 0. Thus, showing nothing in chart. Please check the query.(This also impact ROI dashboard)
Note:
a. Sample data for utilised budget added
2. Comment on Budget Dashboard (Based on UAT data):
- Approved budget pie chart actualy showing utilised budget and Utilised budget is showing nothing. Please relocate the label and charts.
Note:
a. Approved budget pie chart should be same with Overall dashboard.
b. event_borang_p is for utilised budget.
c. Sample data for utilised budget added
3. Comment on Programme Dashboard (Based on UAT data):
- "NUMBER OF APPROVED EVENT BY PROGRAMME TYPE IN 2015" shows nothing while the chart from Overall Dashboard shows there is data.
- New finding: Please add status completed and confirmed in the query
4. Comment on ROI Dashboard (Based on UAT data):
- In "IMPACT - ROI BY PROGRAMME TYPE IN 2015" chart, which calculate ROI = Sales Generated / Utilised Budget, sales generated is 0. Thus, showing nothing in chart. Please check the query.
Note:
a. Sample data for utilised budget added
#21
Updated by Shahidan Syahirman almost 9 years ago
updated:
1. need to revise utilized budget / sale generated = roi formula for the correct computation.
2. fix approved budget piechart in overall dashboard not same with approved budget piechart in approved budget dashboard.
utilized budget still no data in database to be shown in piechart.
3. added confirmed and completed status in query.
4. refer to 1
#22
Updated by Shahidan Syahirman almost 9 years ago
- Status changed from Development / Work In Progress to Internal Testing
- Assignee changed from Shahidan Syahirman to Lim Leonard
hi leo,
fix the issues with the dashboard layout including 3D to 2D.
Please kindly assist
Thank You
#23
Updated by Lim Leonard almost 9 years ago
- File DB - Budget 2.png added
- File DB - budget.png added
- File DB - JPPPA.png added
- File DB - overall 2.png added
- File DB - overall.png added
- Status changed from Internal Testing to Development / Work In Progress
- Assignee changed from Lim Leonard to Shahidan Syahirman
hi Iman,
Please fix the layout,
as described in the attachment
thank you
#24
Updated by Shahidan Syahirman almost 9 years ago
- File sample.jpg added
hi leo,
regarding the alignment, it is based on the resolution of the computer used.
by referring to sample.jpg. it show that the align are correct if it on my laptop resolution.
please advise on this
thank you
#25
Updated by Shahidan Syahirman almost 9 years ago
- Status changed from Development / Work In Progress to Internal Testing
- Assignee changed from Shahidan Syahirman to Lim Leonard
update:
fix other issues other then the chart background alignment
thank you
#26
Updated by Lim Leonard almost 9 years ago
- Status changed from Internal Testing to Development / Work In Progress
- Assignee changed from Lim Leonard to Shahidan Syahirman
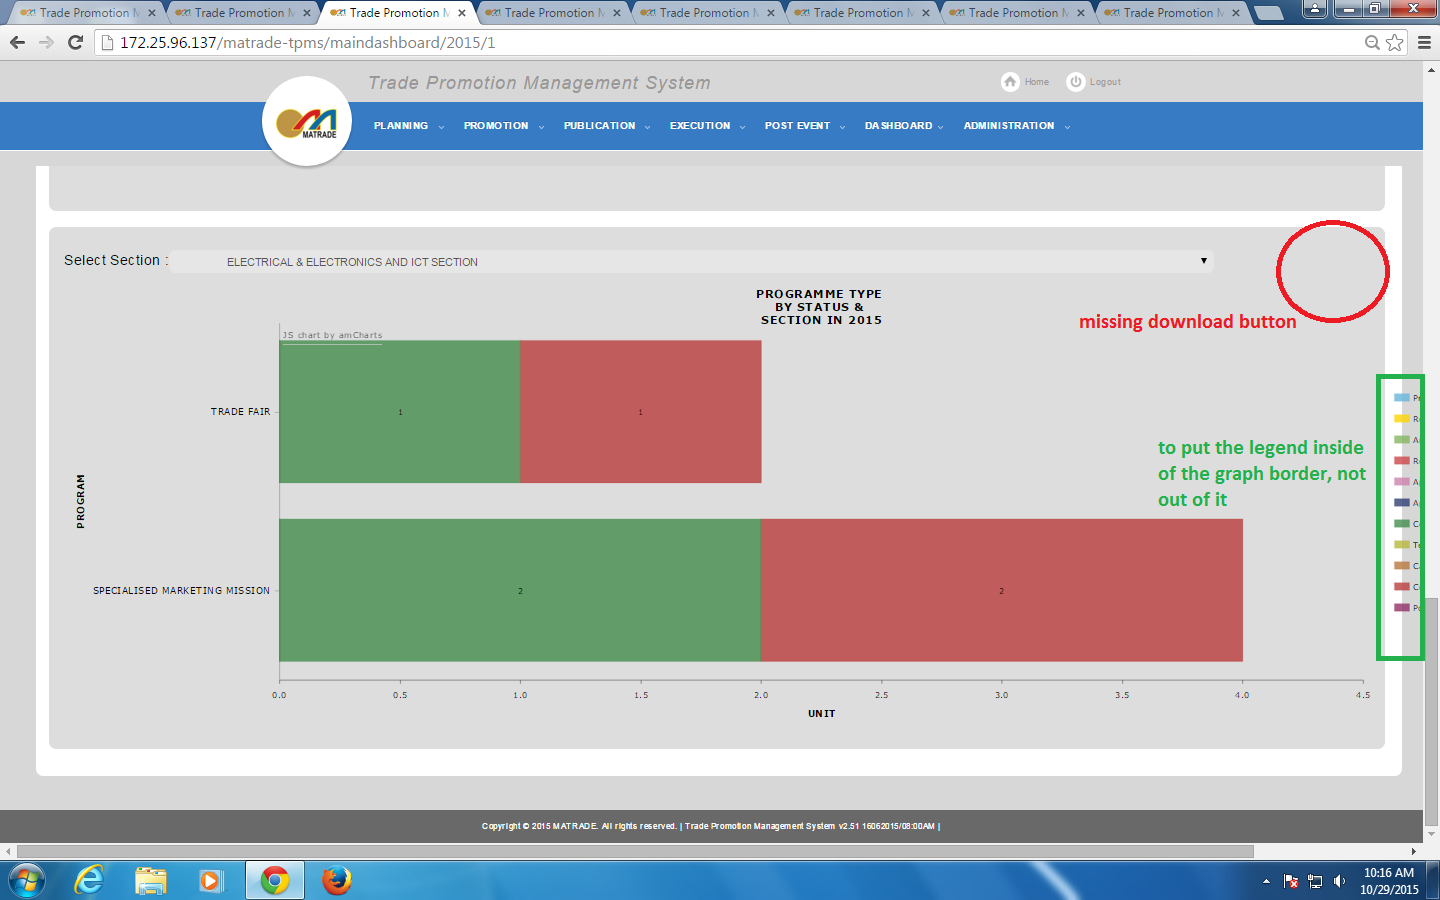
Hi Iman,
there are some chart that dont have download button,
please reconfirm,
thank you
#27
Updated by Shahidan Syahirman almost 9 years ago
leo,
can you tell me which chart missing the download button?
because i don't find any chart missing the download button
#28
Updated by Shahidan Syahirman almost 9 years ago
- Status changed from Development / Work In Progress to Internal Testing
- Assignee changed from Shahidan Syahirman to Lim Leonard
i don't find any chart that don't have download button
#29
Updated by Lim Leonard almost 9 years ago
- Status changed from Internal Testing to Work Completed-End life cycle